
When it comes to mobile technology, it's important to know your investment and efforts are worthwhile.
We have always offered Google Analytics reports, but what if you could access your reporting anytime, directly in your app's admin portal? Now, you can!
All app clients will now receive two new dashboards for their events and meetings: Configuration-at-a-Glance, which is a visual app setup guide, and Overview Stats, which provides event stats by the number.
Configuration-at-a-Glance
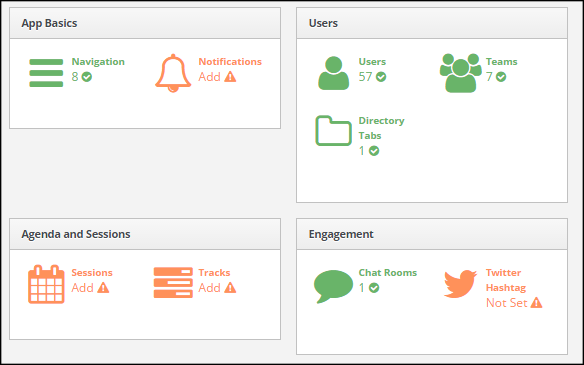
When logged into the admin portal and entering an event, the first screen clients are greeted with is the configuration-at-a-glance dashboard. This screen visually and quickly shows administrators what is ready to launch and what is still needed to make their app fully functional with all the bells and whistles.
Icons shown in green mean the feature has been setup while the orange icons show the feature has not. To set a feature, just click the icon and you'll be taken the feature's setup screen in the admin portal.
Overview Stats
The second dashboard provides a report of your app stats by the number for before, during, and after your event. The tables at the top show your app stats by active users, activity, and app setup. Below these tables is your first graph, which shows user activity over time. Toggle between app activities to see where users took action over the course of your event.
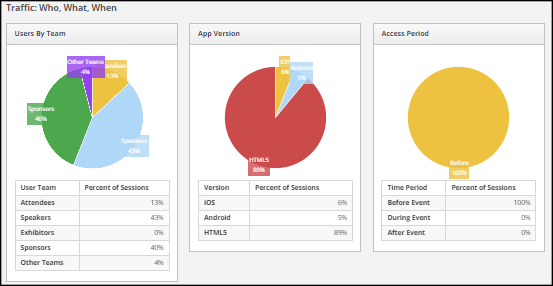
Next comes traffic reporting. Users by team, app version, and access period are all shown in visual pie charts. An example screenshot of this data can be found below.
Last but not least is the user activity by team bar charts. These show number of users total vs. who checked in and who was active in the app by team.
Conclusion
Both of these new dashboards come free with any R@H mobile app purchase.
Do you have any questions about our new event dashboards? Or would like to see something added to these dashboards? Be sure to let us know your thoughts in the comments below. We'd love to hear from you!