
Android v. iOS v. the Others
In order to design the most effective event management mobile app for your association, understanding which operating system (OS) is most popular among users is crucial. Looking at our own event clients, we found iOS mobile users at 74% and mobile users of Android at 26% (More info on this can be found here).
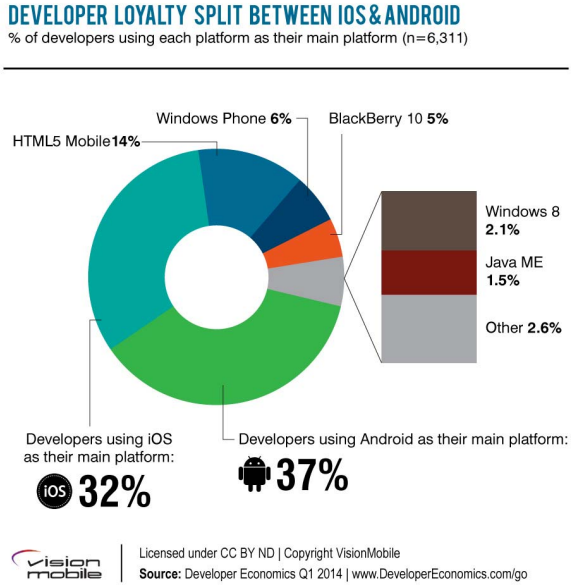
According to Vision Mobile’s study, over 94% of smartphone sales in the fourth quarter of 2013 were Android and iOS devices. Developing mobile event apps for these platforms is not only safe but necessary to capture the most market share. Therefore, it’s no surprise developers are spending most of their time in these areas (37% for Android and 32% for iOS). HTML5 Mobile is the next highest percentage in loyalty at 14%.
Not only should associations know which operating systems are booming but also which are dropping off the grid. Thus, being on top of technological trends refrains one from getting left behind. For example, Blackberry is an OS that is beginning to decline in users. Because of this, 15% of developers plan to abandon Blackberry 5/6/7 and 10% for Blackberry 10, its newest software. On the contrary, 20% plan to adopt the Windows Phone platform to their developing strategies of mobile apps in 2014.
Tablets
With a prediction of every Internet user having 5 devices/ connections by 2017, developers must take the use of multiple devices into consideration. According to a Cisco study, tablets will increase by 39% to 425 million devices by 2017. Similar to mobile devices, tablets primarily run on Android and iOS operating systems. Our own client research was completely skewed to iOS with 95% of users and Android at 5%. Blackberry and Windows tablets were accounted for, however had incredibly small percent values (0.02% and 0% respectively).
Vision Mobile’s research implies Android is favored over iOS to the consumer, with 67% of tablet sales in Android and 30% in iPads. The belief behind this gap is the cost difference between and Android tablet and iPad rather than it being a perfect substitute product. Interestingly, tablet targeting developers tend to prioritize iOS over Android. 52% design for iPads while 28% develop for Android, making it a distant second.
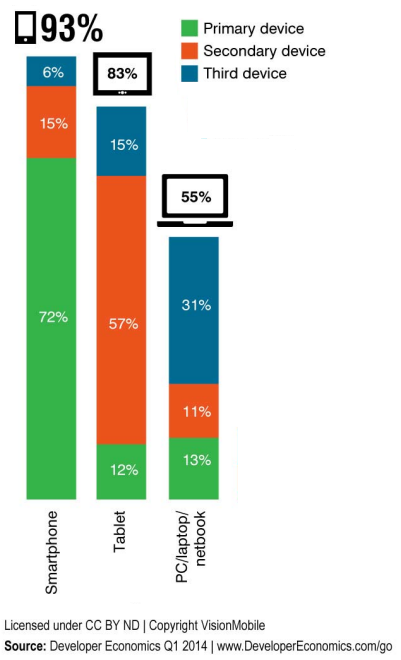
Located to the right is a graphic image that represents the three primary devices consumers utilize: smartphones, tablets, and PCs/laptops/netbooks. The top percentages show how much attraction each device has within the market. The values within the colored columns represent the actual percent developers attribute to each device’s screen. For example, tablets attract 83% of app developers, but only 12% are making this device their primary development screen. This implies tablets are commonly seen as a companion device by consumers, since 57% of developers are making it their secondary device screen and 72% are making smartphones their primary device.
To learn more about mobile operating systems and other current mobile trends, visit our resources webpage.
For the full Vision Mobile Developer of Economics Q1 2014 report, visit Vision Mobile.